Graphics and Computer Analysis on MT4
The MetaTrader 4 platform provides access to a wide range of chart analysis tools. These tools can be found on the «Graphical Tools» toolbar.
On this panel, we see 10 different icons.

The first one is anarrow or the standard mouse cursor (selected by default).
The next is crosshair, which allows checking the price and date/time anywhere on the chart. The crosshairs will allow you to measure the height of the movement in pips and see how many bars/candles the price movement continued. Another convenient way to select a crosshair is to click on the central mouse button (wheel).
The vertical line is useful when dividing the chart into periods or for marking a candle/bar.
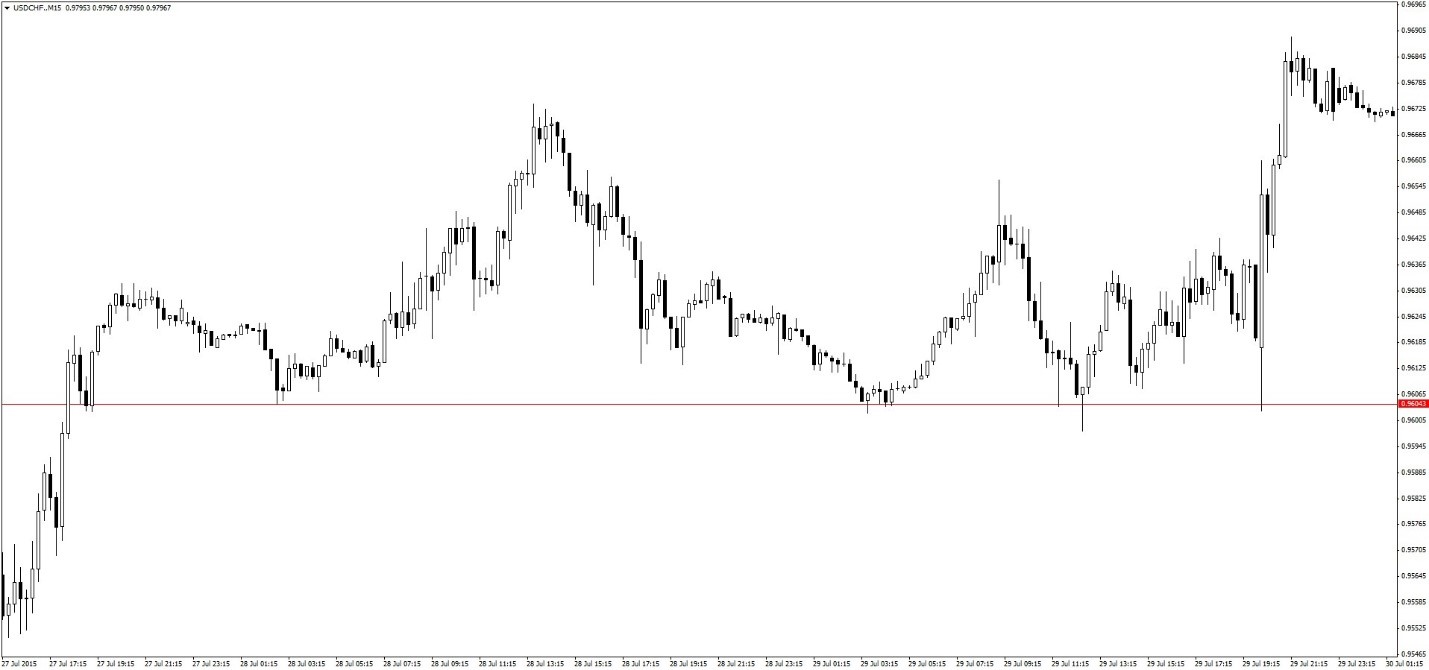
The horizontal line is a very useful tool for marking support and resistance levels. Also allows you to select channels on the chart.
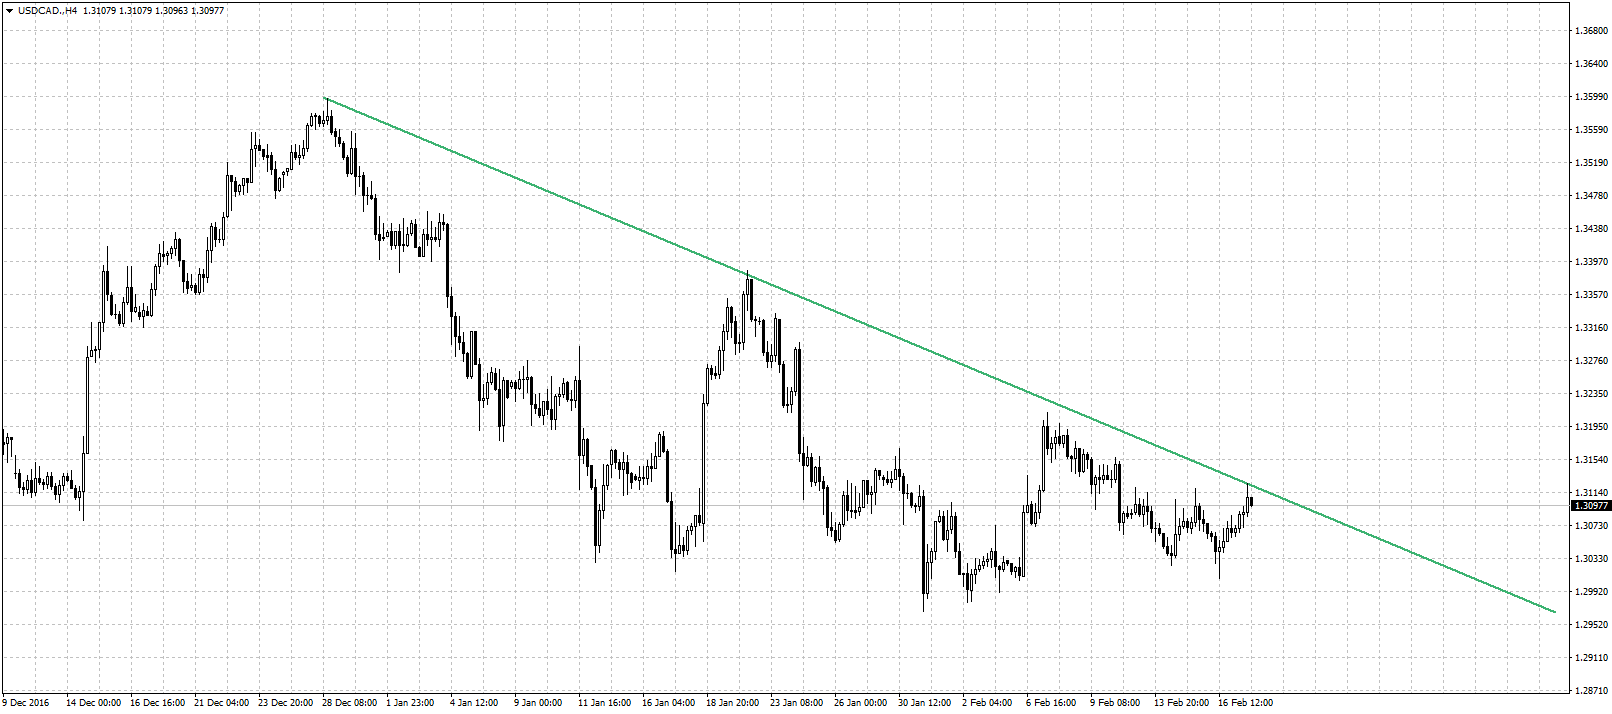
Trend line. Allows marking an upward and downward trend by drawing a line through the highs or lows. Below you can see the trend line option.
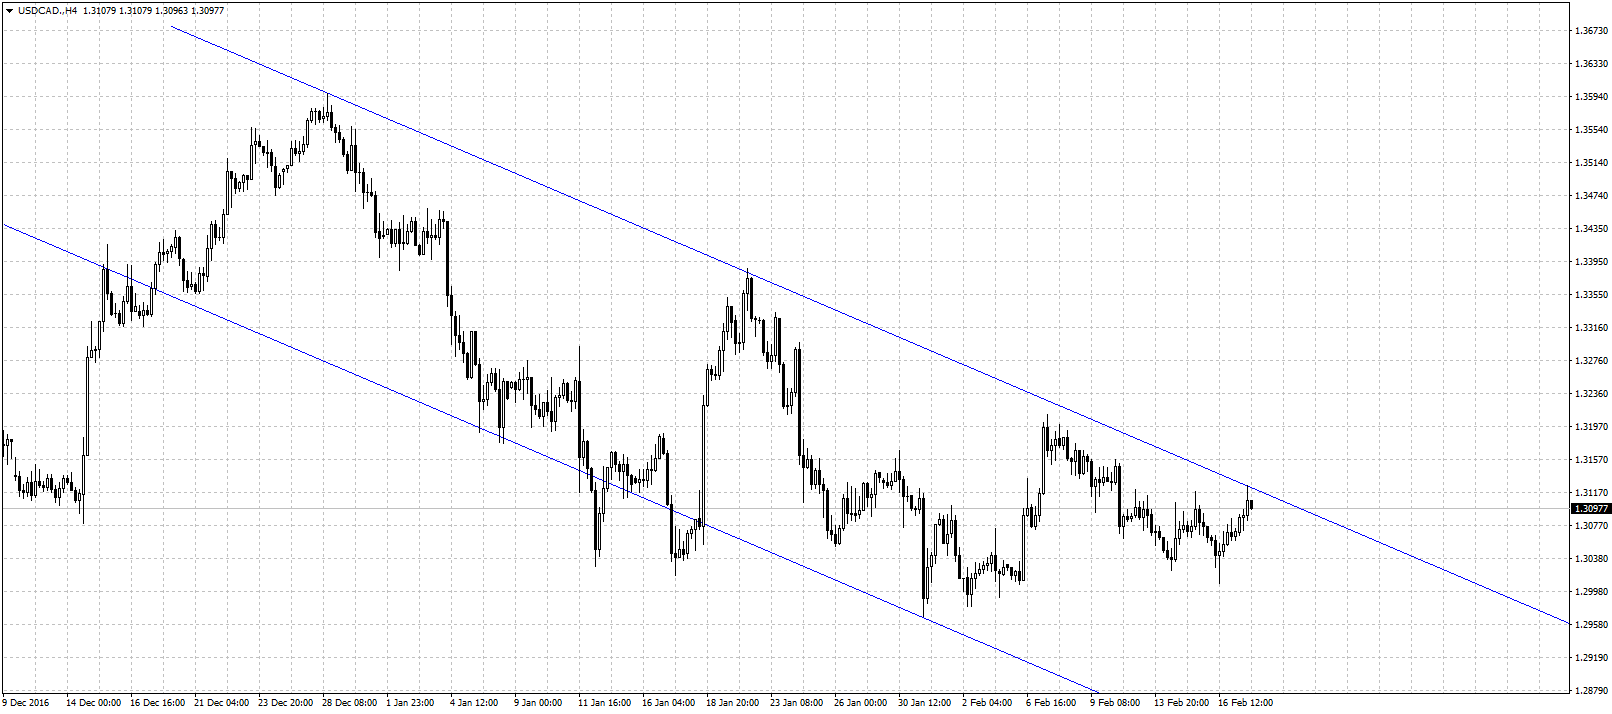
Equidistant channel – represents a trend line with a parallel channel line. An alternative way to draw a channel is to build a trend line (as shown above), and then select it and drag it to the desired location while holding down the Ctrl key.
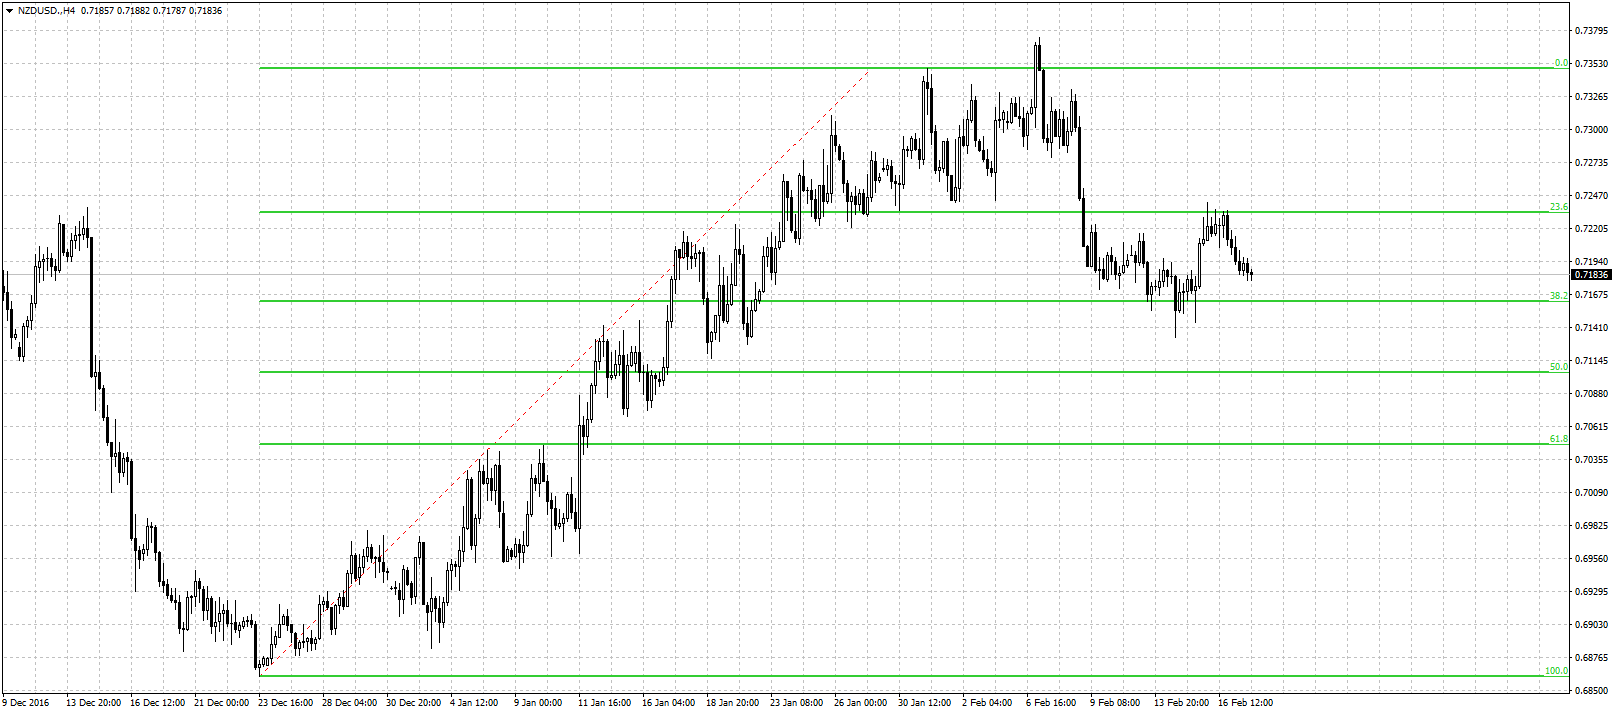
Fibonacci Levels is one of the most popular technical analysis tools. The correct application of Fibonacci levels and extensions allows you to determine significant support and resistance, as well as calculate the goals of the upcoming movement.
Drawing text – allows putting inscriptions on the chart with level marks or any other comments. The text will move along with the schedule (attached to a specific place);
Text label – allows you to put an inscription on the chart, but unlike the previous version, the text is attached to a place on the screen and will remain motionless when scrolling through the chart.
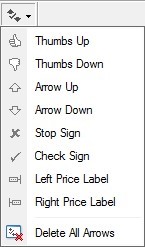
Icons – can be plotted for informational purposes.
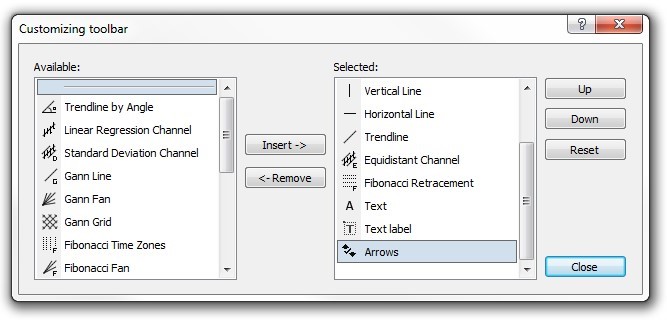
Any tool on the chart can be edited. To do this, double-click on it, and then click the right mouse button and «properties». You can change the colour, line thickness and other personalized parameters. You can also expand the tool palette. To do this, right-click anywhere in the panel «graphic tools», then «configure» and move the necessary options from the left list (available) to the right list (active).
Now that we’ve reviewed the basic tools available on the MT4 platform, we can begin to use them in our daily market analysis.

